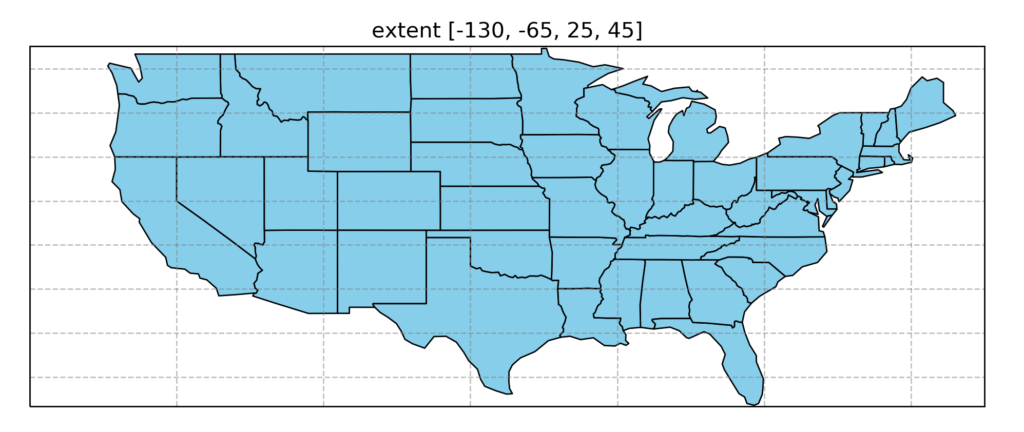
本稿では、アメリカの一部を描画してみます。
サンプルコード
import matplotlib.pyplot as plt
import cartopy.crs as ccrs
import cartopy.feature as cfeature

fig = plt.figure(figsize=(12, 8))

ax = fig.add_subplot(1, 1, 1, projection=ccrs.PlateCarree())

ax.set_extent([-130, -65, 25, 45], ccrs.Geodetic())

ax.add_feature(cfeature.STATES, facecolor='skyblue')

gl = ax.gridlines(crs=ccrs.PlateCarree(),
                  linewidth=1, color='gray', alpha=0.5,
                  linestyle='--')

gl.xlabels_top = False
gl.ylabels_right = False

ax.set_title('extent [-130, -65, 25, 45]', size=15)

plt.tight_layout(w_pad=5)
plt.show()