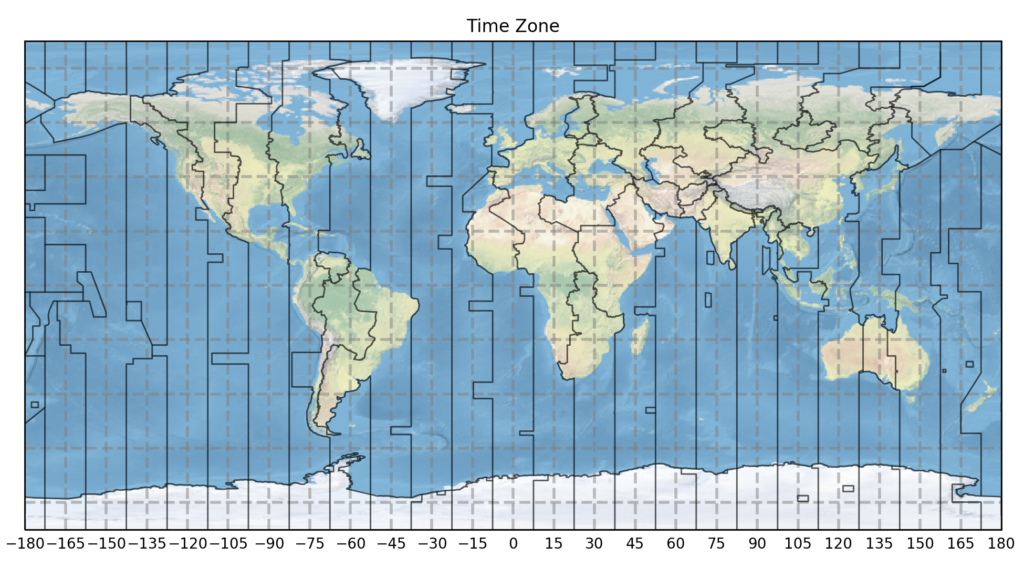
Matplotlib、Cartopy、タイムゾーンをshpで取得して描画してみます
import matplotlib.pyplot as plt
import numpy as np
import cartopy.crs as ccrs
from cartopy.feature import ShapelyFeature
import matplotlib.ticker as mticker
import cartopy.io.shapereader as shapereader

fig = plt.figure(figsize=(12, 8))

ax = plt.axes(projection=ccrs.PlateCarree())

ax.stock_img()
ax.coastlines(zorder=0)

shpfilename = shapereader.natural_earth(resolution='10m',
                                        category='cultural',
                                        name='time_zones')
shape_feature = ShapelyFeature(shapereader.Reader(shpfilename).geometries(),
                               ccrs.PlateCarree(), edgecolor='black', facecolor='none')

ax.add_feature(shape_feature, alpha=0.4, zorder=5, lw=1)

gl = ax.gridlines(crs=ccrs.PlateCarree(), draw_labels=True,
                  linewidth=2, color='gray', alpha=0.5, linestyle='--')

gl.xlabels_top = False
gl.ylabels_left = False
gl.ylabels_right = False

gl.xlocator = mticker.FixedLocator(np.linspace(-180, 180, 25))

gl.xlabel_style = {'size': 10, 'color': 'black'}

ax.set_title('Time Zone', size=12)

plt.show()