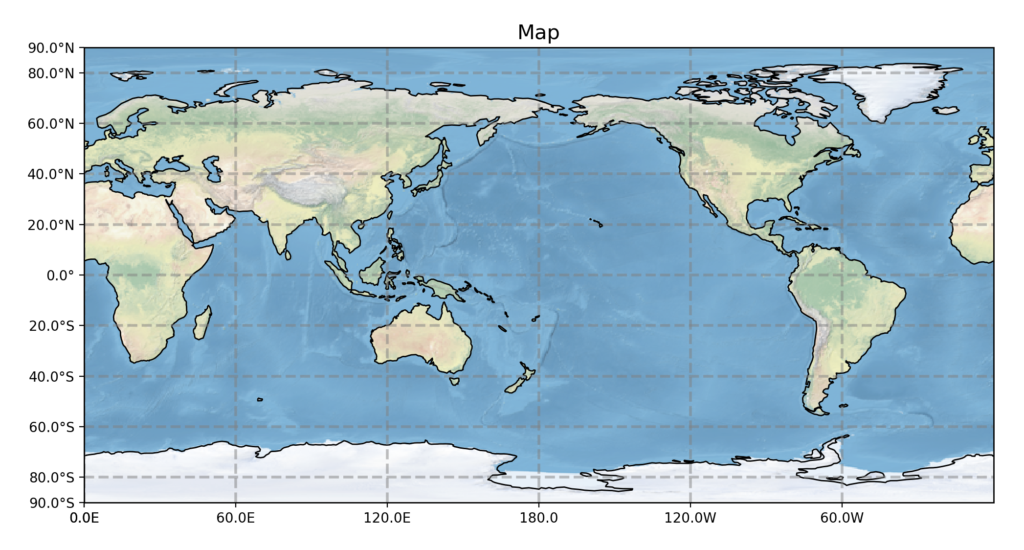
今回は地図にグリッドライン、緯度と経度を追加して描画します。
サンプルコード
import matplotlib.pyplot as plt
from cartopy.mpl.ticker import LongitudeFormatter, LatitudeFormatter
import cartopy.crs as ccrs

fig = plt.figure(figsize=(12, 8))

ax = fig.add_subplot(
    1, 1, 1, projection=ccrs.PlateCarree(central_longitude=180))
ax.set_global()
ax.stock_img()
ax.coastlines()
gl = ax.gridlines(crs=ccrs.PlateCarree(), draw_labels=False,
                  linewidth=2, color='gray', alpha=0.5,
                  linestyle='--')
gl.xlabels_top = False
gl.ylabels_right = False

ax.set_xticks([0, 60, 120, 180, 240, 300, 360], crs=ccrs.PlateCarree())
ax.set_yticks([-90, -80, -60, -40, -20, 0, 20, 40,
               60, 80, 90], crs=ccrs.PlateCarree())
lon_formatter = LongitudeFormatter(zero_direction_label=True,
                                   number_format='.1f', degree_symbol='')
lat_formatter = LatitudeFormatter(number_format='.1f')
ax.xaxis.set_major_formatter(lon_formatter)
ax.yaxis.set_major_formatter(lat_formatter)

ax.set_title('Map', size=15)

plt.show()