タカ
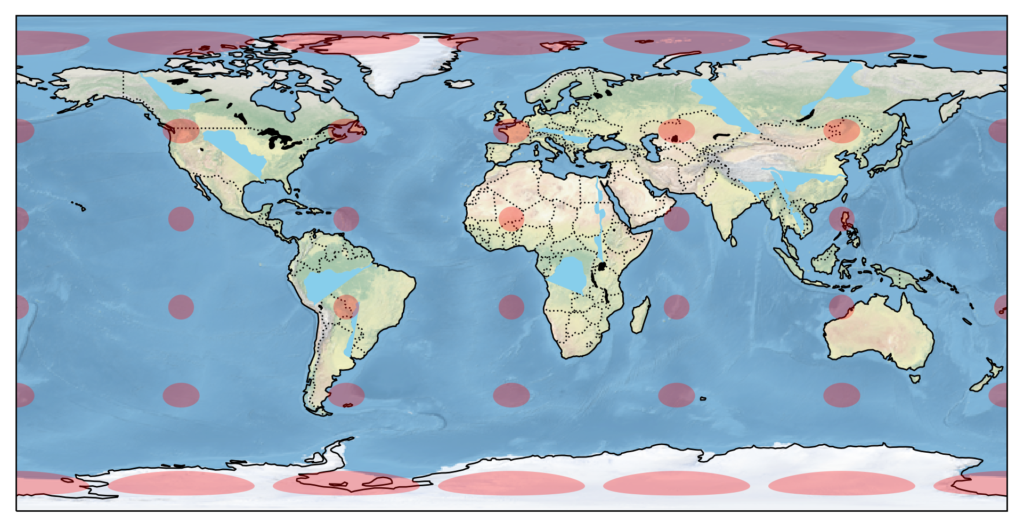
MatplotlibとCartopyの機能を使って川などを描画してみます。
ax.set_global()で、座標系に地球全体を指定します。
ax.stock_img() で、背景にデフォルトの画像を表示します。
| 引数 | 領域 |
|---|---|
| cfeature.BORDERS | 国の境界線 |
| cfeature.COASTLINE | 海岸線 |
| cfeature.LAKES | 湖 |
| cfeature.LAND | 土地 |
| cfeature.OCEAN | 海 |
| cfeature.RIVERS | 川 |
ax.tissot()で、テイソーの指示楕円(投影法による歪みを視覚的に表すもので、今回は、地図の中に楕円を描画します)
海岸線の線のスタイルをダッシュで幅を3、国の境界線を線のスタイルをコロンで描画します。
サンプルコード
import cartopy.crs as ccrs
import cartopy.feature as cfeature
import matplotlib.pyplot as plt

fig = plt.figure(figsize=(12, 8))
ax = fig.add_subplot(1, 1, 1, projection=ccrs.PlateCarree())

ax.set_global()
ax.stock_img()
ax.add_feature(cfeature.BORDERS, linestyle=':')
ax.add_feature(cfeature.COASTLINE, linestyle='-', lw=1)
ax.add_feature(cfeature.LAKES, color='black')
ax.add_feature(cfeature.LAND, color='gray')
ax.add_feature(cfeature.OCEAN, color='blue')
ax.add_feature(cfeature.RIVERS, color='skyblue')
ax.tissot(facecolor='red', alpha=0.3)
plt.show()


